


America’s War Economy: The Military-Industrial Complex
People often cite the U.S. military-industrial complex as evidence of an economy sustained by war. That view has some merit but lacks economic precision. The United States is not a classic war economy in which the bulk of the national output is military production. Instead, it has something more refined: an embedded, permanent defense-industrial subsystem within the world’s largest civilian economy. It is distinctive not only because of high military spending. It’s the institutional machinery that links threat assessment, congressional authorisation, military requirements, research and development, procurement, private capital, industrial capacity, foreign military sales, sustainment and eventual stockpile replenishment together.
The budget request for national defense for FY2026 was approximately $1.012 trillion, which included $961.6 billion for the Defense Department. The typical request was $339.5 billion for operations and maintenance, $194.7 billion for military personnel, $153.3 billion for procurement and $142 billion for research, development, test and evaluation. Additional reconciliation funding significantly raised the total for the DoD. The size is unbelievable. But size alone does not make America a war economy.
Testing the War-Economy Claim
One useful measure is the Defense Dependence Ratio (DDR):
DDR = Defense Expenditure / GDP
If the United States economy were based on war production, then defense spending would have to represent a substantial proportion of the nation’s output. It doesn’t. Discretionary defense spending is projected to be about 2.8% of gross domestic product (GDP) in 2026, the lowest percentage in CBO’s comparable series, which extends back to 1962. Conversely, total federal spending is about 23.3% of GDP. But the historical mobilisations were entirely unique. Defense Business Board data show defense spending at 13.6% of GDP during the Korean War, above 9% at the Vietnam peak, some 6.5% during the Reagan-era Cold War buildup and around 4.9% during the Iraq-Afghanistan period in 2010.
So macroeconomic evidence refutes the strongest version of the ‘war-based economy’ argument. America can produce GDP without war. However, the conclusion changes when we move from the national economy to particular industries. The federal government is the main or almost the only domestic consumer in the markets for aerospace, missiles, nuclear systems, submarines, military electronics, energetics, armoured vehicles, and specialised propulsion. The military-industrial complex becomes economically decisive here.
FY2026 U.S. National Defense Budget
| Category | FY2026 Amount | Share of DoD Request |
|---|---|---|
| National Defense Budget Request | $1.012 trillion | — |
| Department of Defense Request | $961.6 billion | 100% |
| Operations & Maintenance | $339.5 billion | 35.3% |
| Military Personnel | $194.7 billion | 20.2% |
| Procurement | $153.3 billion | 15.9% |
| RDT&E | $142.0 billion | 14.8% |
| Other DoD Spending | ~$132.1 billion | 13.7% |
Defense Spending as a Share of U.S. GDP
| Period | Defense Spending as % of GDP | Economic Context |
|---|---|---|
| Korean War | 13.6% | Major wartime mobilisation |
| Vietnam War Peak | Above 9% | Large-scale overseas war |
| Reagan-Era Cold War Buildup | ~6.5% | Strategic military expansion |
| Iraq–Afghanistan Era, 2010 | ~4.9% | Sustained expeditionary warfare |
| FY2026 Projection | ~2.8% | Lowest level in comparable CBO series since 1962 |
| Total Federal Spending, 2026 | ~23.3% of GDP | Defense is only one component |
Key Comparison
| Indicator | FY2026 |
|---|---|
| U.S. Defense Spending / GDP (DDR) | ~2.8% |
| Total Federal Spending / GDP | ~23.3% |
| National Defense Budget Request | ~$1.012 trillion |
| DoD Budget Request | ~$961.6 billion |
The table helps make your argument: U.S. defense spending is huge in absolute dollars but relatively small compared to the total economy and real wartime mobilisations.
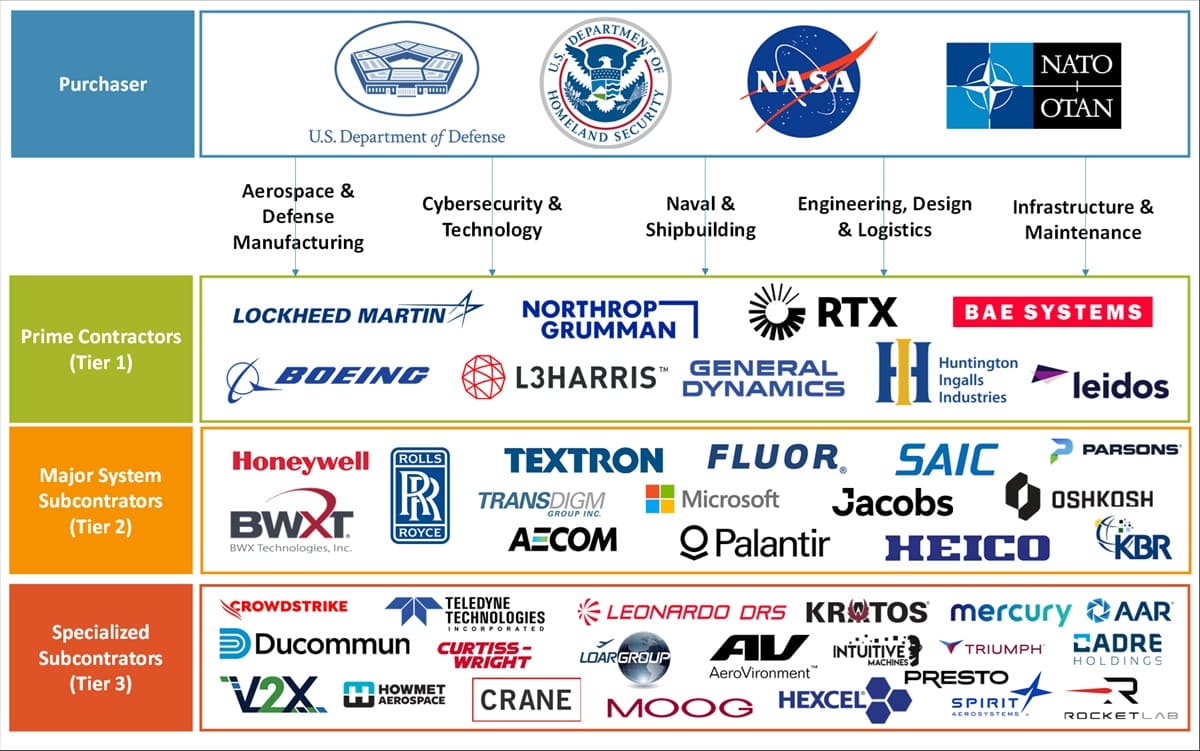
Monopsony vs. Oligopoly
Defense economics is very different from normal commercial economics. The Pentagon is often a monopsonist, a dominant buyer of goods with few other customers. On the supply side, oligopoly is often the rule in the highly specialised defense sector.
The result can be written as:
1 dominant buyer + few qualified producers + high entry barriers = bilateral dependence in the market
Those are tough barriers. When prices rise, you can’t just start a sixth-generation fighter company or a nuclear-submarine yard. Breaking into the field requires security clearances, classified engineering facilities, specialised tooling, certified software, qualified metallurgy, intellectual property, highly skilled labour and often decades of accumulated manufacturing knowledge. Industry consolidation has exacerbated the problem. A Defense Business Board assessment found that, since 2019, five major integrators have received around one-third of all DoD contract dollars each year.
Meanwhile, the defense-industrial base comprises nearly 60,000 supplier firms and employs more than 1.1 million workers. More dramatically, the Board described the post–Cold War industrial structure as shrinking from 51 major systems integrators to five. Its assessment of the industrial base said that around 90% of munitions came from three sources; the defense workforce had shrunk by 66% since 1985, and around 17,000 suppliers had left the defense sector in the past five years. It’s not just about the trillion-dollar headline or even the most strategic part of it. The United States has a huge financial capacity, and its production bottlenecks are fairly narrow.
War Fuels Replenishment
The strongest connection between warfare and industrial revenue appears through inventory depletion. Military inventories obey a simple relationship:
ΔS = P − C − T
where:
S = stockpile
P = production
C = combat consumption
T = transfers to allies
If P < C + T, inventories decline.
The relevant military-industrial indicator is therefore the Replenishment Ratio:
RR = Production Rate/Depletion Rate
If RR goes below 1.0 for a sustained period, the military has to either accept a drop in readiness or boost production. This is one of the most powerful economic mechanisms of the MIC. Even after an ally receives a missile from an American stockpile, it remains part of the economic picture. Removal could lead to a requirement for replacement procurement. That requirement creates contracts for rocket motors, warheads, seekers, electronics, explosives, castings and final assembly. So one outlay of war may inaugurate a period of industrial enterprise.”
Ukraine’s Replenishment Economy
The war between Russia and Ukraine has thrown a harsh and unusual light on this mechanism. Much of the United States’ munitions infrastructure had been designed to produce relatively low production rates for peacetime before February 2022. Many traditional ammunition lines were near the minimum sustaining rate, and two decades of counterinsurgency warfare had emphasised the use of sophisticated precision weapons. Ukraine shocked the world by demonstrating that an industrial war could consume munitions at a fundamentally different rate than counterterrorism campaigns. U.S. production of 155 mm projectiles rose from about 14,000 a month to 36,000 a month after February 2022, according to the Defense Business Board.
It also pointed to the Defense Production Act and Ukraine’s supplemental funding, which injected billions into munitions expansion. The important military lesson is not just the 157% rise in shell production but also the fact that it was difficult. It was that difficult. It’s not a single production line for a 155 mm round. Its industrial chain consists of projectile forging, machining, explosive filling, propellant, primers, fuzes, packing and quality assurance. “Just adding more final assembly capacity without increasing energetics production only shifts the bottleneck further upstream.
Thus:
Effective Output = MIN(Forging, Explosives, Propellant, Fuzes, Assembly, Labour)
The smallest-capacity node determines sustainable output. This is the basic Theory of Constraints, applied to warfare.

The Hidden GOCO Model
Less understood about American defense production is the fuzzy boundary between “government” and “private industry. The Defense Business Board said the Army owns ammunition plants that produce much of the military’s conventional ammunition, propellants and explosives, but those plants are operated by private contractors. The Government-Owned, Contractor-Operated (GOCO) model is strategically vital.
The government keeps labour, production management, specialised industrial expertise and the supply of critical infrastructure and private companies. It also explains why characterising the MIC as simply private corporations influencing government captures only half the architecture. Governments and industry have become operationally interdependent. The state requires the industry to produce military power. ‘Industry must create demand from the state.
Minimum Production Rates Matter
Demand is another strange feature of defense manufacturers. Commercial producers can address millions of consumers. Missile manufacturers might have one big customer that buys a few missiles a year. If orders fall below a Minimum Sustaining Rate (MSR), suppliers walk away, skilled workers leave, and they mothball tooling, which raises unit costs. Then it can take years to resume production. Production started again. This situation creates a fundamental paradox. Cutting procurement might save money today for the government but cost many times more to restore industrial capability later.
In the language of mathematics:
This equation explains the increased use of multi-year procurement, advance procurement, and funding for capacity expansion. This funding is not only for purchasing arms. It is to retain the industrial capacity to produce the weapons of tomorrow.
War Profits Firms, Not America
This is an important distinction. A defense contractor can profit from a deterioration in geopolitics, even when the overall U.S. economy does not. Combat creates a need for depot maintenance, spare parts, accelerated modernisation, foreign military sales, and the replacement of munitions and vehicles. But the military spending has an opportunity cost. Nor can the interceptor designer design commercial power equipment. The money for civilian infrastructure cannot be spent on missiles.
Energy materials, semiconductors, machine tools and skilled labour remain scarce economic resources. War may thus boost some sectors but diminish national wealth by destruction, borrowing, displacement of resources and lost opportunity for investment. Measured GDP includes military production. Why? Production of goods and services. This statement is not to imply that destroying the weapon so generated adds to wealth. The main distinction is between the production of productive capital and the production of GDP.
The Acquisition Paradox
The problem is even bigger; big budgets don’t automatically make for rapid combat capability. GAO’s 2026 Weapon Systems Annual Assessment finds that major programmes now take, on average, more than 12 years to deliver their capabilities. It also found that nearly half of the MTA programmes it assessed had begun development using immature technologies. The DoD planned to spend at least $49 billion on 23 of its most expensive Middle Tier Acquisition programmes.
This results in what can be called the Acquisition Paradox:
Financial Superiority ≠ Industrial Superiority ≠ Tactical Superiority.
Money has to go through requirements generation, contracting, engineering, testing, certification, tooling, production and fielding BEFORE it becomes military power. The efficiency of conversion can be written conceptually as:
Combat Power = Acquisition Efficiency * Budget * Ability to Deliver * Speed of Delivery
A trillion-dollar budget with poor acquisition efficiency could provide less deployable capability than a smaller budget backed by faster manufacturing.
The Engineer Shortage
Next-generation combat aircraft were among the most revealing publicly acknowledged details about FY2026. While the Pentagon financed the crewed, sixth-generation F-47 fighter, it limited development work on the Navy’s F/A-XX. Officials said the decision was specifically intended to keep the defense-industrial base from being flooded with an oversupply of qualified engineers. That’s a ploy. The constraints were far greater than money. It was people capital. The expansion of the high-tech military manufacturing requires a relatively small pool of engineers with specialities in low-observable structures, propulsion, electronic warfare, mission systems, software integration and classified design environments. You cannot simply invest money and expect to have a new generation of experienced engineers.
Industrial capacity is therefore about:
Does the MIC Benefit from Conflict?
The economically defensible answer is much less extreme than either of these. Defense companies clearly benefit from a stable demand for procurement. It’s beneficial for congressional districts to have jobs, according to Army updates. Contractors want stability in the programme. FOREIGN CUSTOMERS GET LONG PRODUCTION RUNS. Depletion of the stockpile generates replenishment contracts. Such incentives could create a systemic bias in favour of heavy defense spending. High defense spending does not mean endless American warfare. Deterrence itself is creating enormous demand. A larger Chinese Navy means more vessels.
Missile proliferation, in turn, creates air defense requirements. Russian nuclear modernisation drives the requirements for strategic forces. Hypersonic weapons will give rise to new sensors and interceptors. Drone warfare is where counter-UAS programmes originate. Thus, the modern MIC operates on a self-reinforcing technological cycle: Threat → Requirement → R&D → Procurement → Deployment → Adversary Countermeasure → New Requirement and real fighting speeds up the cycle. Geopolitical competition can keep it going forever.

Strategic Outlook
The evidence does not support defining the entire United States as a war economy. Today, defense expenditure is approximately 2.8% of gross domestic product (GDP) and is significantly less than during the Korean and Vietnam Wars and the Cold War. But it would also be a mistake to write off the military-industrial complex. The civilian economy contains a large and highly specialised defense subsystem: over a million workers, tens of thousands of firms, government-owned industrial infrastructure, concentrated prime contractors, specialised laboratories and supply chains that cannot readily exist without government demand.
Ukraine has disclosed its Achilles heel. The United States can assemble enormous financial resources with remarkable speed. However, you cannot build industrial capacity at financial speed. Factories require tooling. Energetic plants require infrastructure. Submarines require shipyards. Missiles need special motors. Aircraft. Need experienced engineers. Though it takes time and effort. That’s the strategic angle.
Conclusion
The American military-industrial complex is relatively unimportant because it allegedly starts wars for profit. What this argument means at a deeper level is that US military power has become locked into a permanent private-public industrial architecture that requires a constant demand to survive. It really feeds the demand. Depletion and Replenishment. However, it can be sustained by great power competition, modernisation and deterrence, even without war.
So the question for military planners isn’t whether the United States can afford to spend $1 trillion. It can. The key question is whether the system can produce dollars into missiles per month, ships per year, planes per production run, and combat-ready systems per unit of time faster than an adversary. In a long peer war, that conversion rate, not the headline defense budget, may ultimately determine the victor.
Important Note on Sensitive Information
This document is not a publication of classified, leaked or illegally obtained material. The less visible findings on supplier concentration, GOCO facilities, workforce erosion, munitions bottlenecks and engineering constraints are drawn from publicly released U.S. government documents. The fact is that truly classified and protected details cannot responsibly be presented as such.
References
- U.S. Department of Defense. FY2026 National Defense Budget Request and Background Briefing on the FY2026 Defense Budget. Budget structure, procurement, RDT&E and industrial-capacity priorities.
- Defense Business Board. Industry Partnerships for Crises, DBB FY25-01. Defence-industrial employment, supplier concentration, GOCO infrastructure, munitions production and surge-capacity analysis.
- Congressional Budget Office. The Budget and Economic Outlook: 2026 to 2036. Defense expenditure, federal outlays and GDP comparison. (Congressional Budget Office)
- U.S. Government Accountability Office. Weapon Systems Annual Assessment: Requiring Mature Technologies Could Enable Shift to Rapid Delivery, July 2026. Acquisition timelines and technological maturity. (GAO)
About the Author