
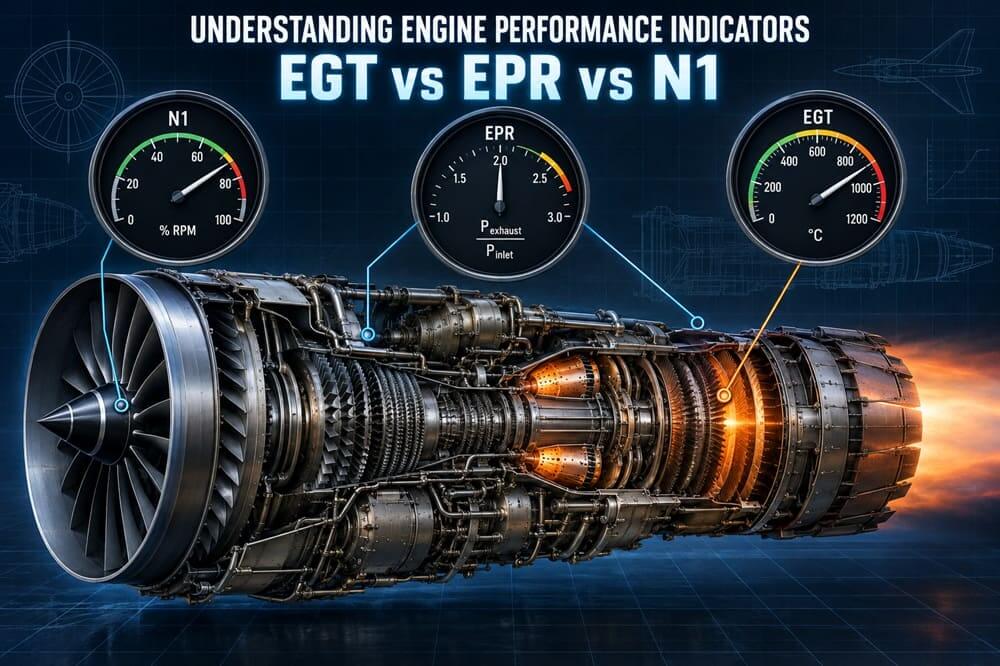
Understanding Engine Performance Indicators: EGT vs EPR vs N1
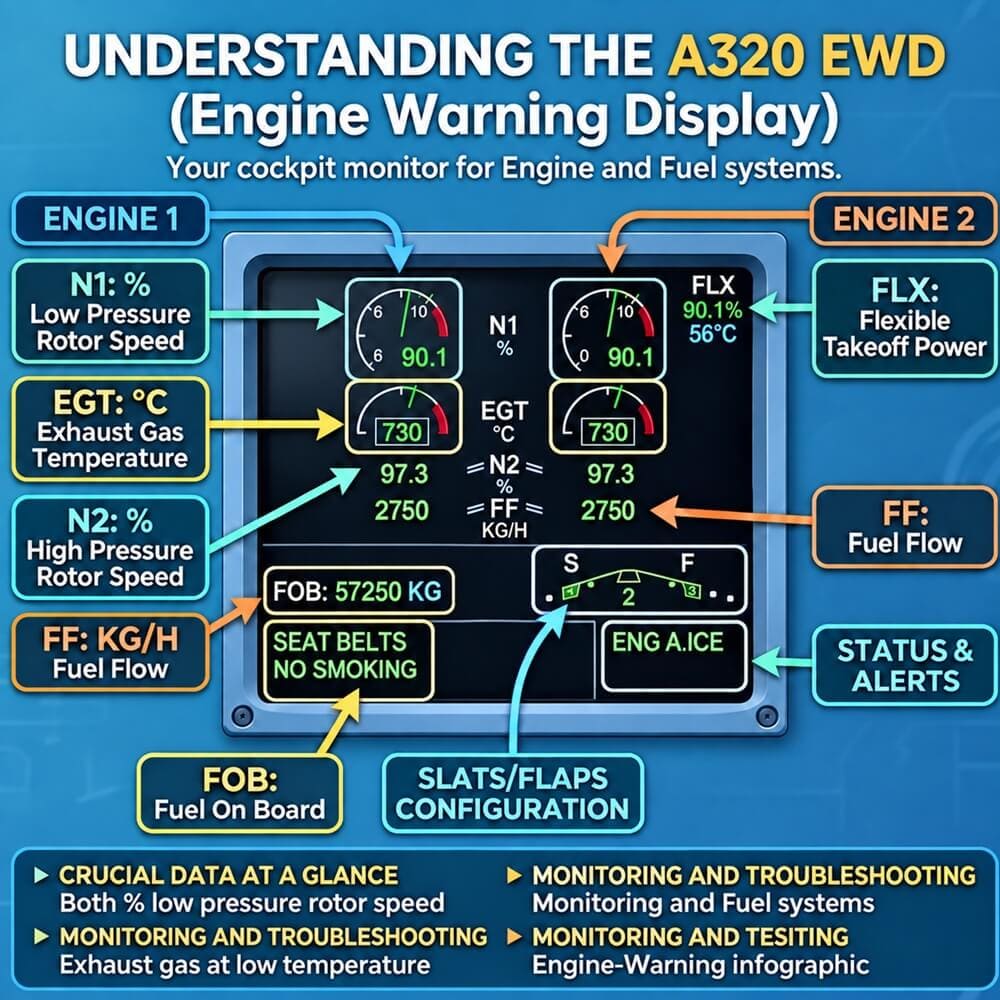
Gas-turbine engines of today can generate enormous thrust by carefully balancing the airflow, pressure, fuel flow, rotational speed, and temperature. But pilots can’t directly measure the thrust in flight. Aircraft monitor engine performance and operating limits through several parameters, including exhaust gas temperature, engine pressure ratio, rotor speed, and fuel flow.
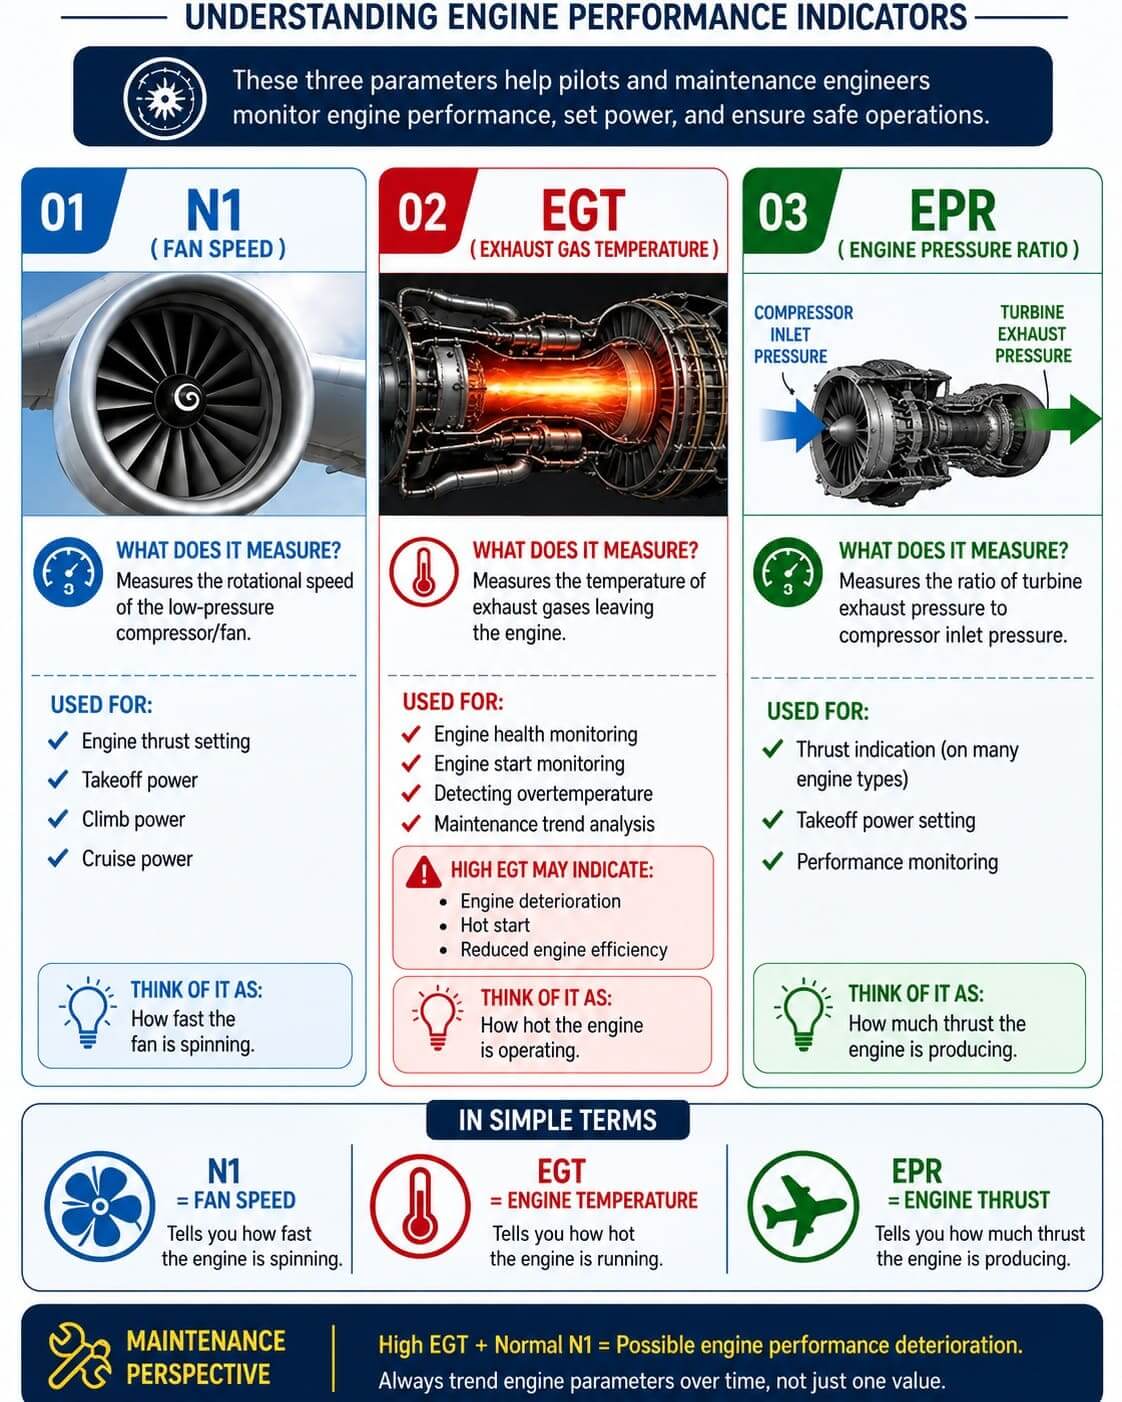
Three of the most important are exhaust gas temperature (EGT), engine pressure ratio (EPR), and N1 rotor speed. These signs often come together, but they are basically different physical phenomena. EPR is mainly the pressure-based engine output, N1 is the low-pressure rotor or fan speed, and EGT is the thermal condition of the engine. Studying their relation can identify engine degradation, compressor stall, sensor failures, and potentially serious thrust anomalies.
EPR: A Pressure-Based Measure of Thrust
The engine pressure ratio compares the total pressure at the rear of the engine with the total pressure entering it. A simplified expression is
EPR = Pt7 / Pt2
where Pt2 is the total pressure at the inlet and Pt7 is the turbine exhaust pressure. Precise station numbering depends on engine design; for example, NASA documentation describes total engine pressure ratio as downstream station Pt8 over Pt2. EPR provides an engine-specific indication of thrust, although its relationship to actual thrust depends on operating conditions and engine design. EPR was particularly critical of turbojets and early low-bypass turbofans, such as the Pratt & Whitney JT8D.
The pressure ratio is a useful indicator of engine output, so manufacturers could define a target EPR for takeoff, climb, and other operating conditions. So a typical takeoff procedure would have the pilots pushing the throttles forward to an indicated value, such as 2.0 EPR, rather than commanding a specific percent RPM. However, EPR has a significant limitation: it relies on pressure probes. If the inlet Pt2 probe is blocked, contaminated, damaged, or iced, then the mathematical ratio can be wrong and the engine is perfectly fine.
Case Study: Air Florida Flight 90
This weakness was tragically displayed on January 13, 1982, when Air Florida Flight 90 attempted to take off from Washington National Airport in severe winter weather. The Boeing 737-200 crew had picked a target takeoff setting of about 2.04 EPR. The investigators found that ice had blocked the Pt2 inlet-pressure probes to the engines. Thus the EPR shown reached the commanded value, though the actual engine output was still considerably lower.
The NTSB findings showed the engines were producing a thrust of about 1.70 EPR, or about 3,750 lb less net thrust per engine than expected. Other signs might have given away the discrepancy. EGT and high-pressure rotor speeds were lower than expected for takeoff power. The lesson is clear: EPR is only a reliable thrust-setting parameter if the pressure measurement system provides valid data.
N1: Measuring the Low-Pressure Spool
N1 is the low-pressure rotor rotational speed of the engine. The N1 system in most two-spool turbofans powers mainly the fan, low-pressure compressor, low-pressure turbine, and shaft. The high-pressure compressor and turbine are normally called N₂ and spin on their own. Normally the cockpit does not show the true shaft speed (which may be thousands or tens of thousands of revolutions per minute) but N1 as a percentage of some defined reference speed.
Thus:
N1 (%) = Actual LP rotor speed / Reference rotor speed × 100
Importantly, the 100% N1 isn’t necessarily the mechanical redline. FAA guidance says the operational maximum rotor speed can exceed the nominal reference value of 100%. With high bypass turbofans, the fan airstream contributes significantly to overall thrust. Hence, corrected N1 is closely related to thrust.
This has made N1 a useful primary parameter for thrust setting on many modern engines. N1 is very sensitive to disturbances in the compressor or fan. If N1 is decreasing or oscillating with increasing EGT, this may indicate airflow disruption, compressor stall, fan damage, or degrading engine efficiency.
EGT: The Engine’s Thermal Report Card
The EGT (Exhaust Gas Temperature) is the temperature of the gases after they exit the combustion and turbine sections. The related measurements could be described as EGT, ITT, TGT, TIT, or TOT depending on the engine architecture. All provide information about the thermal operating condition of the engine. Manufacturers install temperature sensors at designated gas-path stations, with their precise locations depending on the engine architecture.
The FAA guidance says turbine temperature is one of the fundamental limitations on gas-turbine operation, since excessive temperatures can damage turbine blades, vanes, seals, and other hot section components. EGT differs from N1 and EPR because it is not essentially a thrust measurement. Instead, it tells engineers how much thermal energy the engine must produce to achieve a desired level of performance. This is a difference, and it is very valuable for engine health monitoring by EGT. Here are two identical engines, both producing nearly identical N1.
If:
Engine A: N1 = 94%, EGT = 770°C
Engine B: N1 = 94%, EGT = 835°C
In this case, engine B may require substantially greater thermal loading to produce approximately the same fan speed. Possible causes include compressor fouling, increased blade-tip clearance, turbine deterioration, seal leakage, erosion, hot-section wear, or inefficient airflow.
EGT Margin: A Critical Maintenance Indicator
One of the most important but less visible engine-health measurements is EGT margin. In simplified form:
EGT Margin = EGT Redline − Corrected Maximum-Power EGT
With a new or recently overhauled engine, there’s usually quite a bit of margin between the temperature required to produce rated thrust and the certified temperature limit. Compressor and turbine efficiency decreases with age. This may require more fuel and higher turbine temperatures to produce the commanded thrust.
Consequently, the available EGT margin progressively decreases as engine efficiency deteriorates. Engine-condition-monitoring systems can correct EGT data for outside-air temperature, pressure, altitude, Mach number, bleed demand, and thrust setting, Airbus says. The developed trend helps maintenance organisations identify deterioration and estimate the remaining time on the wing. Here’s an example of a key engineering principle: Two engines can develop the same thrust but have completely unique amounts of excess power.
EGT vs EPR vs N1
| Parameter | What It Measures | Primary Value | Major Weakness |
|---|---|---|---|
| EPR | Engine pressure ratio | Thrust indication | Vulnerable to pressure-probe errors |
| N1 | Low-pressure rotor/fan speed | Thrust setting and spool monitoring | Does not directly reveal thermal stress |
| EGT | Gas-path temperature | Thermal limit and engine health | Not a direct thrust measurement |
The strongest diagnosis is therefore based on correlation, not on a single instrument. For example, high EGT with normal N1 could be a sign of efficiency loss.
- Low N1 and low EPR could indicate a loss of power or a rollback of thrust. Compressor instability may be manifested as fluctuating N1 and rapidly rising EGT.
- Normal EPR + low N1/EGT unexpected = suspect EPR sensor.
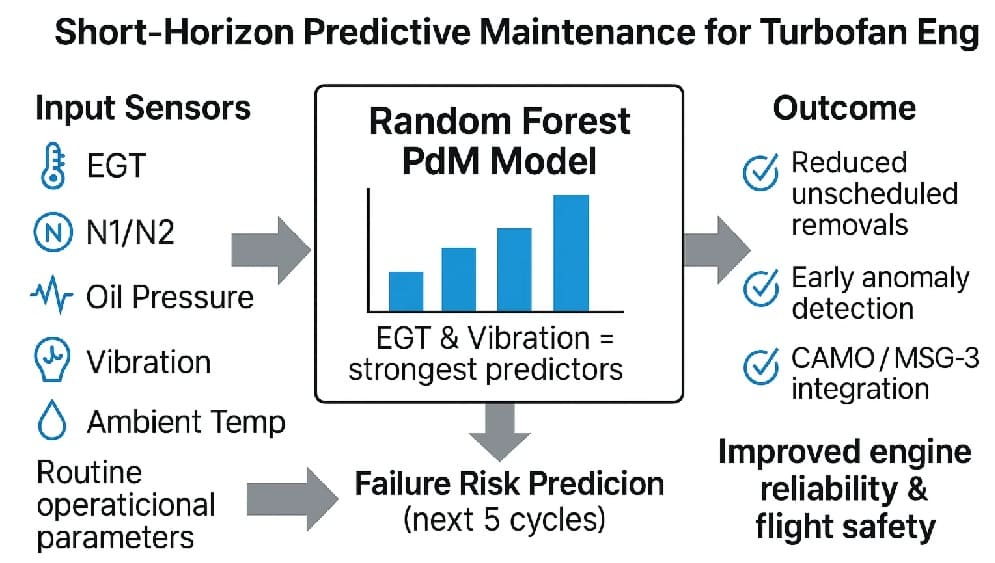
- High EGT + abnormal fuel flow + vibration is a very strong indicator of mechanical or gas-path damage and should be investigated.
Case Study: British Midland Flight 92
Another major example is British Midland Flight 92. The recorded parameters for the Boeing 737-400 fan-blade failure showed that the left engine N1 oscillated and dropped compared to the right engine. The left-engine EGT increased by about 100°C compared to the healthy engine, reaching a difference of about 125°C.
The fuel flow was variable, and the vibration indication was at the maximum of five units displayed. These parameters provided a diagnostic fingerprint of the damaged engine. But the crew turned off the good right engine. The accident underscores the need to consider engine indications as a system, not in isolation.
Military Engine Applications
The military engine is more complex because the use of afterburners, variable exhaust nozzles, variable compressor geometry, inlet distortion, rapid throttle movements, and extreme attack angles all affect conventional engine parameters. For example, the RPM indication can be combined with turbine-temperature parameters, fuel flow, nozzle position, oil pressure, and digital engine-control warnings of military aircraft.
A fighter engine at military power can maintain commanded thrust despite variations in RPM or temperature due to altitude, inlet temperature, Mach number, and nozzle scheduling. So modern FADEC systems do much more than just provide you with one cockpit indication. In doing so, they are always trading off fuel flow, compressor stability, rotor speed limits, turbine temperature, variable geometry, bleed demand, and, in the case of military engines, exhaust nozzle area.
The Most Important Principle
EGT, EPR, and N1 should never be treated as competing indicators. They answer different questions.
- EPR asks: How much pressure-based engine output is being generated?
- N1 asks: How fast is the fan or low-pressure rotor turning?
- EGT asks: How much thermal stress is required to achieve the commanded performance?
An engine may gradually lose efficiency while maintaining the commanded N1 or EPR, with rising EGT indicating increasing thermal demand under comparable operating conditions. In contrast, an EPR indicating normal but with abnormal N1, EGT, fuel flow, or acceleration could be a sign of the thrust indication itself being misleading. The best engine diagnosis for pilots, maintainers, and military propulsion specialists does not come from reading one number but from understanding the relationship between pressure, rotational speed, temperature, fuel flow, and vibration.
References
- Federal Aviation Administration — Aircraft Engine Operation and Malfunction: Basic Familiarisation for Flight Crews. Defines EPR and N1 as certified thrust-setting parameters and explains the interpretation of abnormal engine indications.
- NASA Glenn Research Center — Engine Pressure Variation: EPR. Technical explanation of engine total-pressure ratios and their relationship to propulsion-system performance.
- Airbus Safety First — Prevention of EGT Overlimit Events. Technical discussion of EGT margin, engine deterioration, flat-rating temperature, and engine-condition monitoring.
- Federal Aviation Administration — Air Florida Flight 90 / Boeing 737-200 Lessons Learned. Investigation of erroneous EPR caused by ice-blocked Pt2 probes and the resulting takeoff-thrust deficiency.
About the Author